Case studyChambers and associations
A recovery program's business map, and the product it became
Wander Willamette

Case studyChambers and associations
Wander Willamette
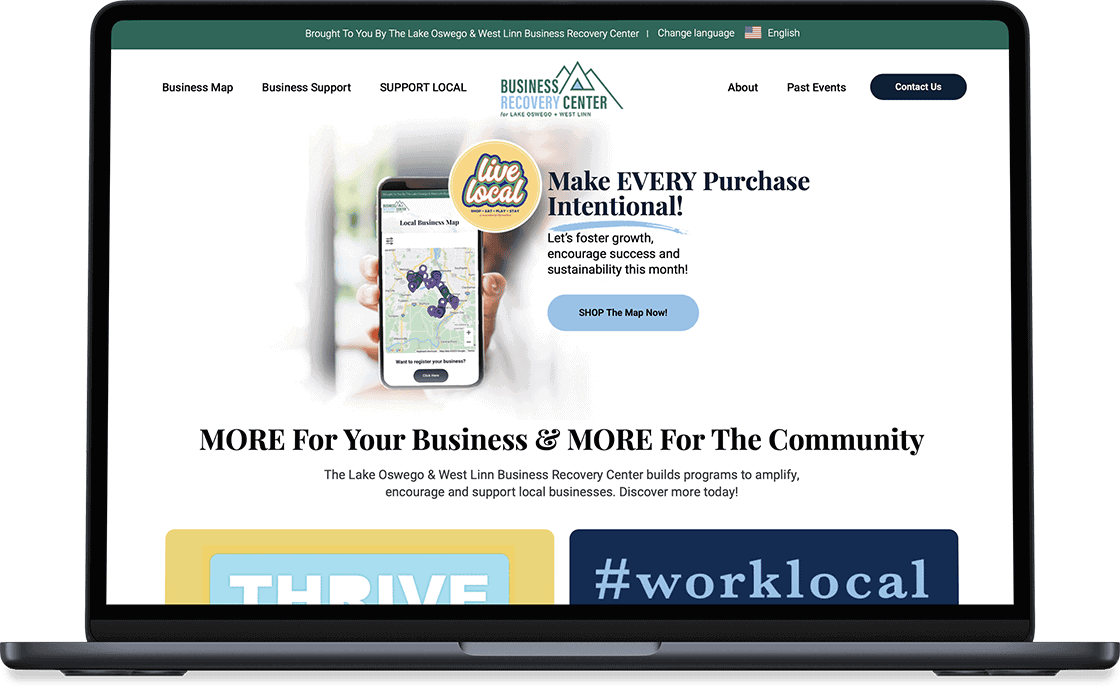
The result
700%
more engagement than the previous site
Reported by the program, two months after launch
Web Excellence Award2023, Community category
Wander Willamette was the public face of the Lake Oswego and West Linn Business Recovery Center, a federally funded program set up to help small local businesses recover from the pandemic. Its job was to connect residents and visitors with local businesses, especially in the categories hit hardest.
It started on a makeshift site, put together before the funding arrived. Once the funding came, the program needed far broader reach, and the money came with federal reporting obligations attached.
The program needed a platform, not a brochure, with business resources, education, events, and an interactive map of local businesses that people could filter by what mattered to them, such as veteran-owned or women-owned. The launch date was weeks away, not months.
We planned it with the program's leadership first, and decided together on a web platform rather than a mobile app. Then we laid out the site's structure and built it in WordPress from scratch, with our own code, minimal plugins, and editing controls so staff could update it every day.
The map is where the plan changed. Our first approach was an existing mapping plugin. It couldn't meet the program's requirements for reporting and for how business data was posted, so we built our own. In one fast, detailed planning session with the program's leadership, we worked through who the map served, what it needed to show, where, and why. Leadership defined how the filters should work, from drilling down to stacking several filters at once and showing the results on the map. We built it to that specification in JavaScript, Bootstrap, and Sass, as its own plugin, with the business data supplied by the program.
Around it, we built ways to capture the data the program's federal reporting required, an events page and calendar, and the operations underneath, including hosting, DNS, email, backups, and analytics.
The site launched in December 2022, two months after we started.
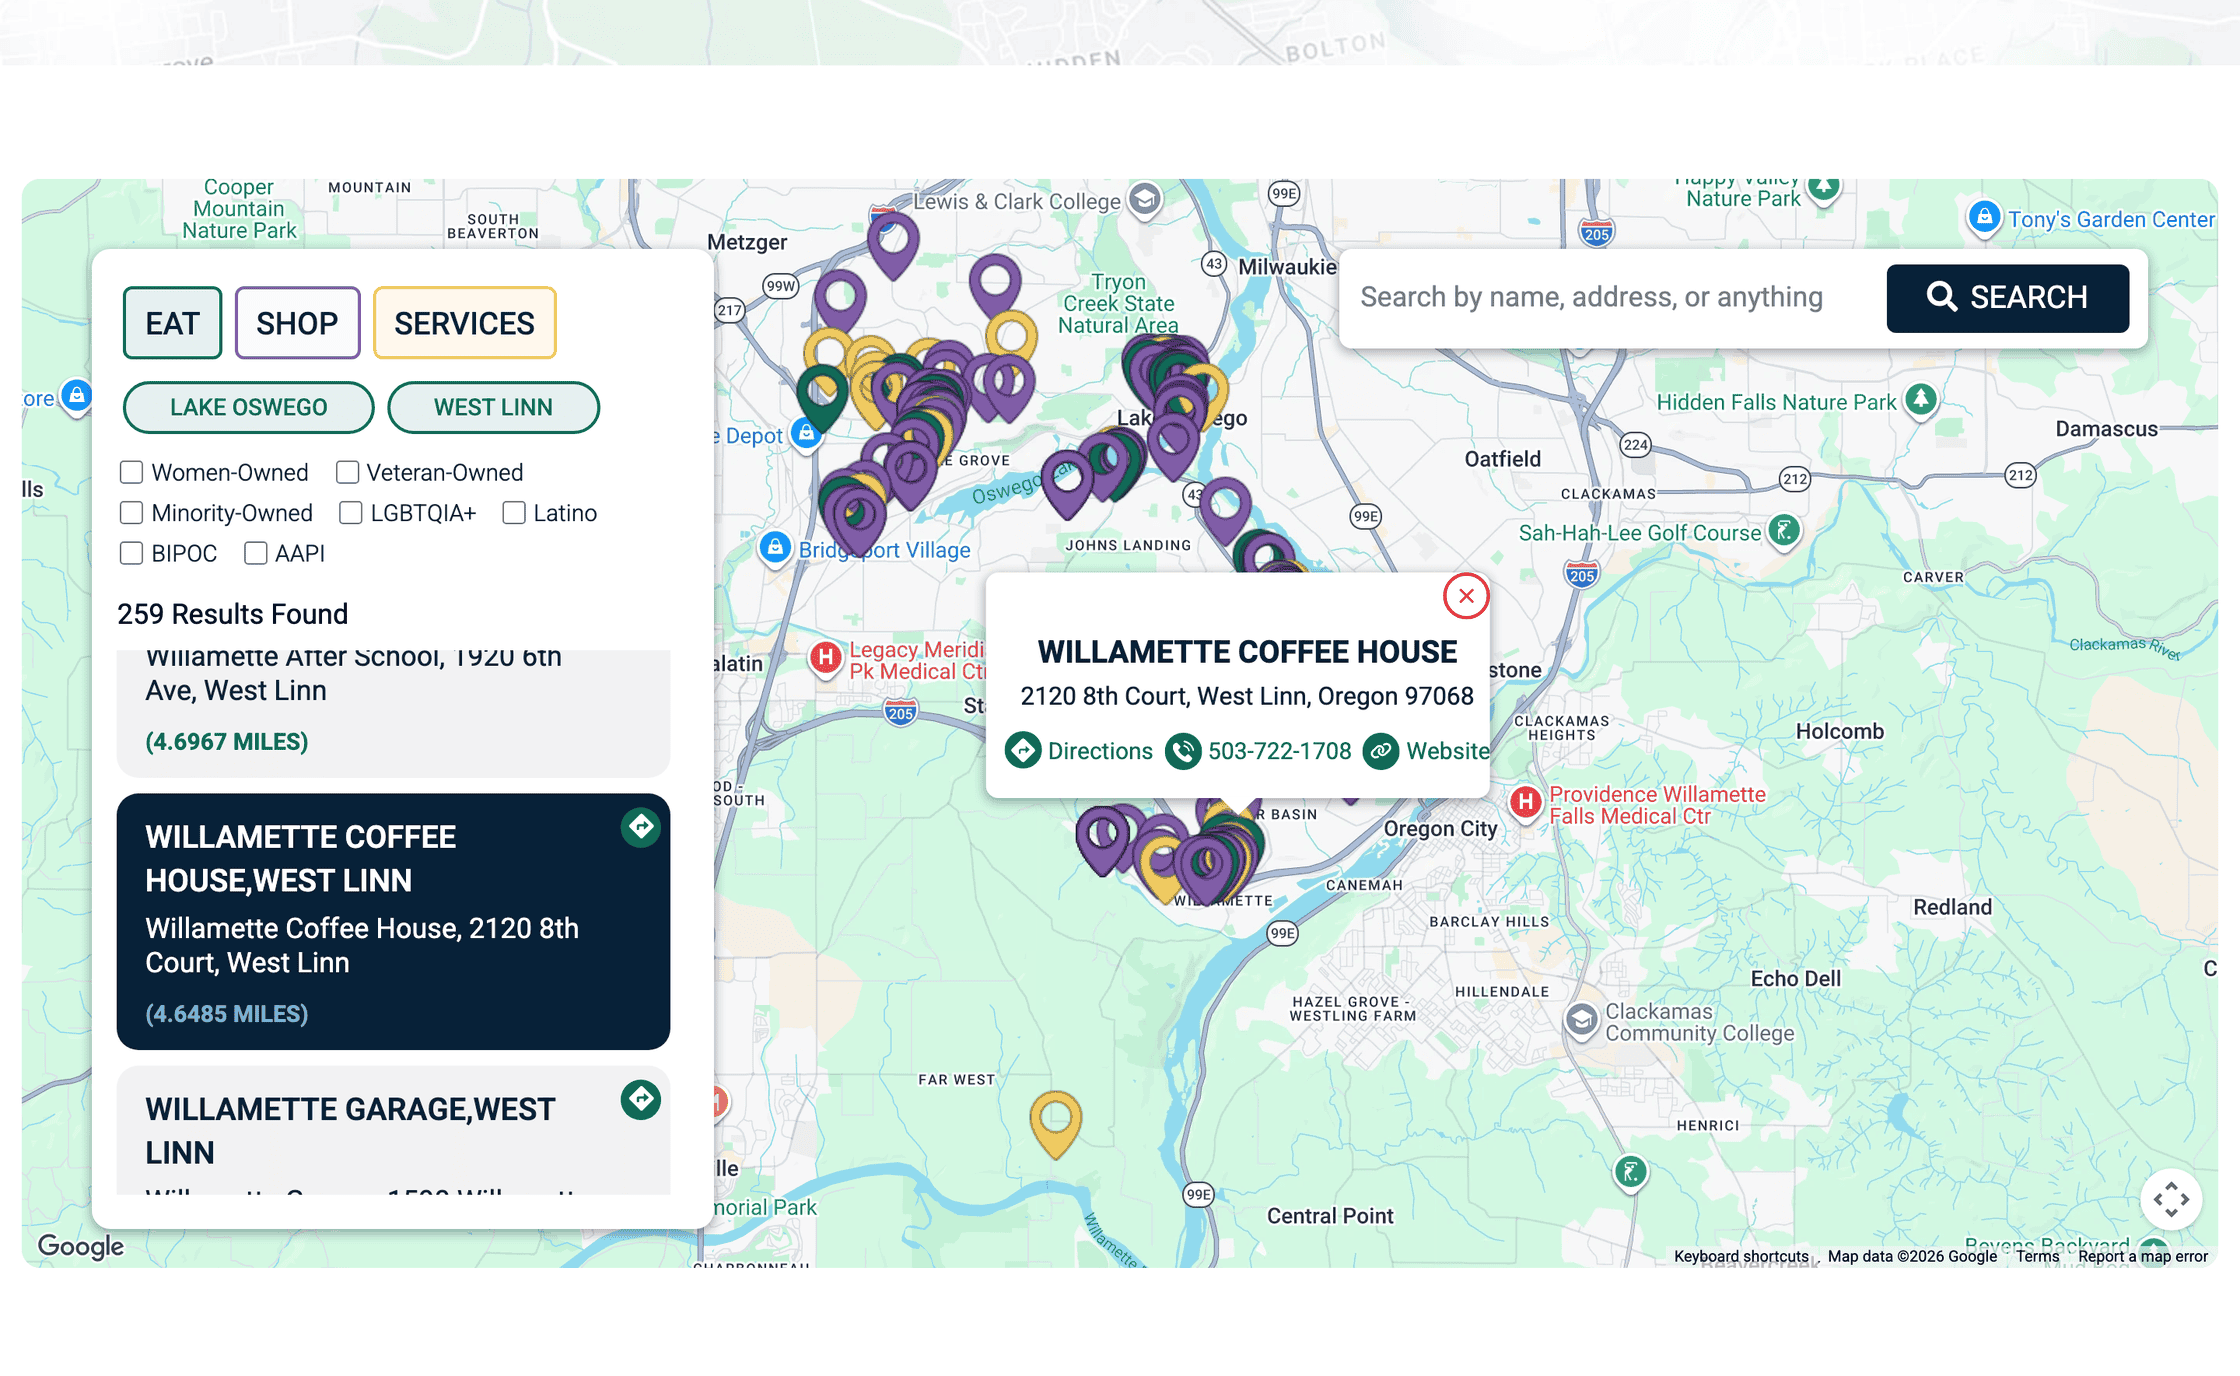
The part most portfolios leave out.
It didn't meet the program's requirements for reporting and for posting business data, and the launch date didn't move. We replaced it with our own, designed around exactly what the program needed.
With weeks to launch, the requirements had to be settled in one detailed session, covering who it served, what it showed, where, and why. The answer to "when" was as soon as possible.
Federal funding meant the platform had to produce the data the program reported on. That shaped the map, the site, and how data was captured, from the start.
Call them if you want someone who can listen to you and put your strategic plan into action.
Two months after launch, the program reported 700 percent more engagement on the new site than on its old one, with analytics it could read every day. The work won a Web Excellence Award in 2023, in the Community category.
Marketing ran alongside the platform as part of the account. Over the following year, from May 2023 to May 2024, the program's Facebook reach rose 793.8 percent and its Instagram profile visits 395.5 percent.
The map outlived the program. Other economic development organizations asked for the same thing, starting with a business resource center in South Clackamas County. With the program director's agreement, the map stayed with us. She expected other organizations would need it, and they did. It became the first version of IronMaps™, the product we continue to build today.
Before this, the program ran on a makeshift site with no way to produce what its funders required. After it, the program had a platform built around its reporting from the start, with its business data under its own control. We managed everything underneath, including hosting, DNS, email, backups, and analytics.
Here, ownership ran both ways. The program owned its platform, and the map it needed became a product other organizations can use.
If this study is close to your situation, these two may be closer.
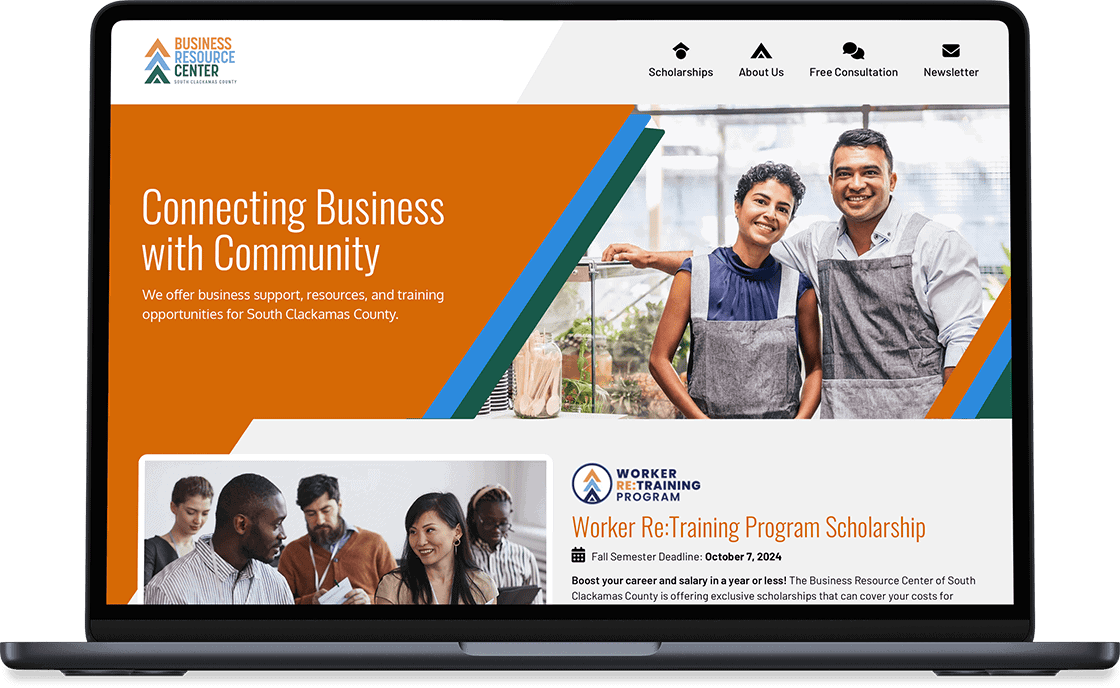
A visual business directory for nine communities, building on concepts from a prior program. Our technology helped with awarding community recovery grants.
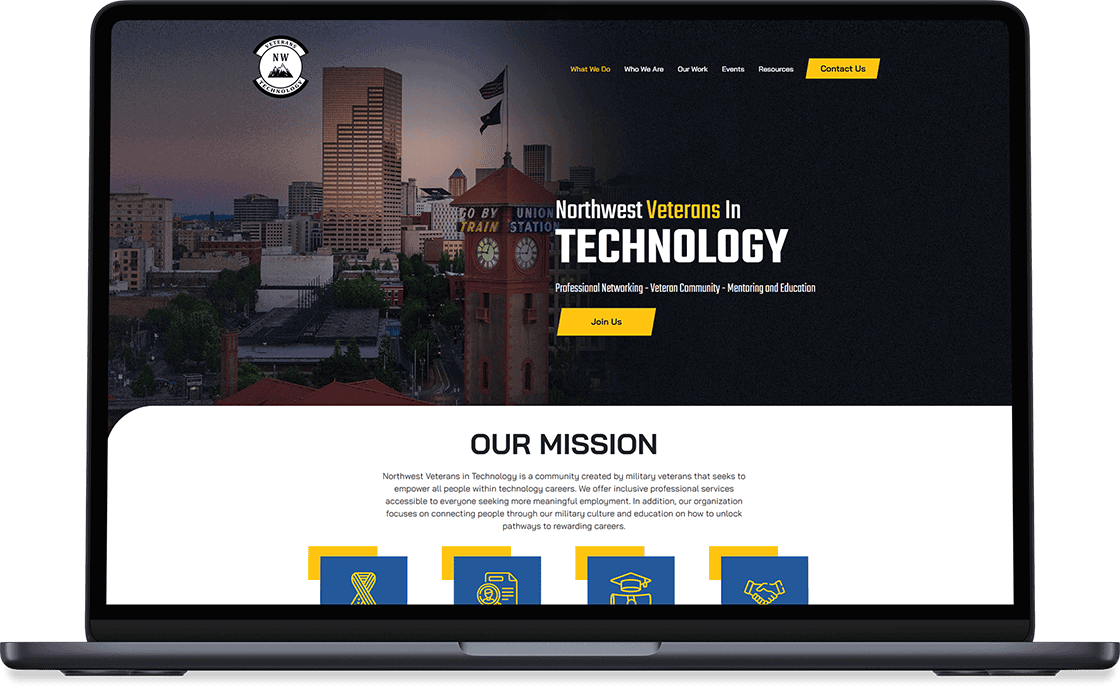
A veterans' technology group had only a Meetup page. We gave it a website of its own and brought its Meetup events onto it, so visitors stayed on the site until they were ready to sign up.
Tell us what your program has to report, and we'll show you what the map can do.

© 2017 to 2026 IronGlove Studio, LLC. IronGlove Studio® is a registered trademark of IronGlove Studio, LLC.